Home » Archives for Rich Torr » Page 4

Author: Rich Torr

Do Our Beliefs Change Risks?

Ask a psychologist or a Bayesian statistician and they will tell you that risk is subjective. The chance of a big bad thing happening is seen through the lens of the individual, fashioned from their personal experiences and lodged in their mental models. See more

Seeking Serendipity

Serendipity is finding something valuable by chance, a fortuitous discovery. Serendipity in business could mean tripping over the next Google by accident. Or spotting an opportunity you weren’t looking for in a corporate blind spot. See more

Exploring Bed-Blocking Pressure

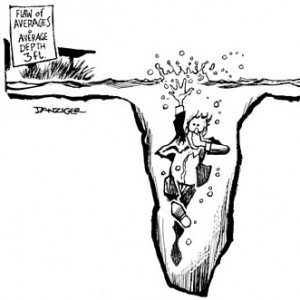
A common media topic over the winter months is the increased pressure on the NHS coupled with the snappily-named ‘Bed-Blocking’; patients who are well enough to leave hospital but are still occupying a bed. We might see this attributed to a ‘crumbling adult care system’ caused by ‘sweeping cuts to local council budgets’. Is the cause really so straightforward?

This visualisation links the NHS England Delayed Transfer of Care to Bed Capacity data for the last 13 months to seek new insights. As with many things in the NHS, the picture isn’t as simple as the media sound bites would suggest.

Click on the image below to launch the interactive dashboard on Tableau Public:

Bed-Blocking Grab

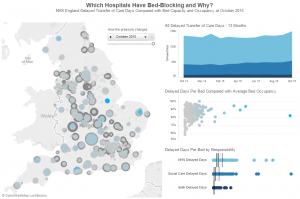
The distribution of Transfer of Care process delays and bed occupancies vary by individual Trust within the Local Authorities they serve. Some are improvement bright-spots, others aren’t. The creation of metrics for ‘Bed-Blocking Pressure’ and ‘Bed-Blocking Effect’ produces geographic Trust ranking.

This is just one example of how we can use visual analytics to explore patterns in your data for better decision-making.

Get in touch to find the stories hiding in your data.

Caveats : There’s still work to do on the geocoding of some Trusts and the use of historical bed capacities/occupancies instead of just the most recent quarter. We could try and factor-in the higher occupancy units. We’ve created a separate drill-down into the Delayed Transfer of Care root causes which reveals insights for combined Local Authorities & Trusts. Get in touch if you’re interested.


The Traveller Caravan Count

The UK Department for Communities and Local Government publishes a statistical count of the number of caravans on both authorised and unauthorised traveller sites across England. The count takes place every January and July and includes both ethnic Gypsies and Travellers and non-traditional travellers.

This visual storyboard shows how this caravan count has changed over time, how it varies by season and the shift to private sites. It also compares Local Authorities by caravan demand on authorised and unauthorised sites.

Click an image to visit the interactive storyboard.

Story4
Local Authority Traveller Caravan Count

Jump Plots

A Jump Plot is a neat visual way to illustrate the variability in elapsed time between events or steps in a process. See more

The Candidate Rejection Journey

How do candidates feel about being ignored and rejected? Far from ambivalent.

A new visual insight from Measureology charts the effect of delaying candidate rejection – both explicit and implicit – using the Net Promoter Score. See more

The Candidate Sentiment Slump

How quickly should recruiters give feedback to retain candidate goodwill and protect the employer brand from collateral damage? A new visual insight from Measureology links applicant feedback response time to the Net Promoter Score. See more

Knockout KPIs

KPIs should give a team the feedback they need to drive performance towards some important strategic goal. So why is it that KPIs are so often a bit lightweight?
See more

The seat of the pants

In his brilliant book ‘The Flaw of Averages: Why We Underestimate Risk in the Face of Uncertainty’ Dr Sam Savage shows us why we need to connect the ‘seat of the intellect to the seat of the pants’. See more