
Ask a psychologist or a Bayesian statistician and they will tell you that risk is subjective. The chance of a big bad thing happening is seen through the lens of the individual, fashioned from their personal experiences and lodged in their mental models.
Our beliefs change our perception of risk relative to the eventual reality, a prediction gap exploited by the insurance and gambling industries which profit by making better statistical bets than we do.
Biases also distort our ability to make rational predictions about risk. The availability bias makes a salient event – one which we can recall more easily – seem more likely than the ones we didn’t think of. This is why that media story or IT outage last week suddenly makes future events seem more likely despite hundreds of days without one.
I was asked recently whether the Visual Strategy mapping we use at Measureology could help to prioritise IT risk investments. I think it can, primarily because it could capture both the similarities and differences in a team’s perception of risk.
The normal use of the Visual Strategy workshop method is to capture the causal beliefs of a team about an improvement and aggregate these mental models into strategies. Network graph tools are used to build a visualisation of these strategies and analyse the flow of influence for reaching goals. Getting shared visibility of how teams are thinking also produces a common motivating purpose with which to execute the improvement, a procedural rationality effect. We then go on to design measures to provide evidence of this improvement execution.
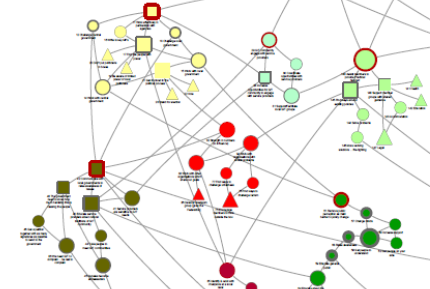
The same method could be used to literally paint a picture of the risk beliefs of the participants and the causal influence over the consequences. Aggregating several perspectives from across IT and the business would produce a density of clusters and paths which reveal shared or disjoint thinking about risk priorities. Just spending time thinking in this causal and visual way can surface previously hidden insights.
Sections of this causal model could then be cast as a Bayesian decision network and use Monte Carlo simulation to model the expected financial losses for each risk relative to an intervention investment. This is the type of probablistic thinking about risk advocated by decision analysts and actuaries. The elegance of this approach is that it can blend the prior knowledge of (calibrated) individuals with historical evidence to model future uncertainty. Risks can then be ranked for investment by their expected losses and limit the propensity for over-engineering. If a loss has only a tiny chance of being over £1m then spending any more than £1m on prevention starts to wipe out any benefit and can lead to even greater losses.
Much of what passes for risk management can itself create an illusion of knowledge which obscures the path to objectively lower probability and impact. The probablistic approach is harder but it trumps high/medium/low ordinal rankings, worst case scenario anchoring or the flaw of averages. These methods don’t attempt to put a price on reducing uncertainty whereas a sensitivity analysis of a probablistic model reveals where investing in better information would lead to better decisions.
If you’re interesting in experimenting with Visual Strategy mapping in a risk context then get in touch.