
When an IT function set out to transform itself from an ugly duckling into a swan it wanted to make its ‘Silent IT’ strategy visible to the business.
Once the fanfare about your transformation has faded what does it look like in the cold light of day? This was the challenge faced by an IT leadership team. After making promises to the board, how could they show strategic improvement in meaningful business language? Measureology helped them to publish the signals of success with a visual dashboard.
The Business Value Story
The forward-looking IT Director decided to take a fresh approach to their business alignment challenge by telling an entirely visual performance story on a single sheet of paper.
He takes up the story:

“The most pressing part of the transformation was stabilisation, a theme we called ‘Silent IT’. Instead of IT being an ugly duckling we wanted to be a gliding swan, paddling invisibly below the surface.
It was important to establish a baseline and then paint a credible picture for the board to answer their questions about how things were going.” said the IT Director.
“Our business model is based on a critical ‘Customer Journey’ which relies on multiple IT services. If this journey stalls then there’s a very real effect on reputational damage and revenue losses”.
“We didn’t want to be claiming that things were better but unable to prove it because our reports were too operational. We needed a solid evidence base for how IT was making a difference to things which mattered for the board.”
There wasn’t a lack of data, like most IT functions there were management tools full of it. The problem was that most metrics, KPIs & SLAs had low business value and the dashboards and reports weren’t right for an executive audience.
A Best Practice Conundrum
“There aren’t any ‘best practice’ shortcuts to measuring IT value because every strategy and business is unique. We were cautious too about ‘importing’ KPIs from somewhere else without a clear purpose and team buy-in. There was some initial skepticism, fear even, about measuring IT through a business lens.”
“Using workshops, Measureology helped us to get to grips with the concept of Silent IT, challenging the language to describe what this would look like in the real world. That led to the design of an entirely new performance measure based on how much disruption of the Customer Journey was caused by IT. For a team & service provider used to reporting on events, activities and contractual targets this turned out to be quite a shift in mindset.”
Visual Management Dashboard
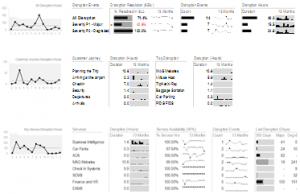
The ultimate output was a dashboard which told the transformation story. For the Silent IT theme this was based on the new measure for IT disruption of both the Customer Journey and other revenue services.
The report was was designed to fit on a single A3 page but was also readable on A4 or on a screen as a PDF. This went through multiple iterations to refine the visual presentation.
The layout was designed so that the chart with the headline message was at the top left corner of the page. The rest of the charts charted a ‘causal’ flow of comparisons which explained this message.
The charts were focused on anticipating and answering questions such as: “Which part of the customer journey was most disrupted by IT?” or “How long before we can expect another IT disruption?” and, fundamentally; “Is IT getting more Silent?”.
Predictive Signals using XmR Charts
A new idea for the team was the use of statistical signals to show performance shifts over time. Measureology introduced the use of XmR charts to show the natural variability in the key measures and detect performance shifts with greater confidence.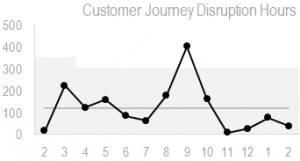
“XmR charts seemed a bit statistical & technical at first” said the IT Director. “But its a far more disciplined way of thinking which stops us looking at numbers and targets in isolation. The first thing we noticed was that the system performance wasn’t shifting spite of some improvement investments. This helped us to focus on the improvement initiatives which were most likely to drive this signal in the right direction.
One big benefit is that we can now predict with confidence what disruption we might expect to see each month. This helps us to see through the noise when we’ve had an exceptional, assignable cause which is worth investigating.”
Disruption Intensity using Spark Bars
Some effort went into to deciding how to show the sources of disruption and which was most business-impacting.
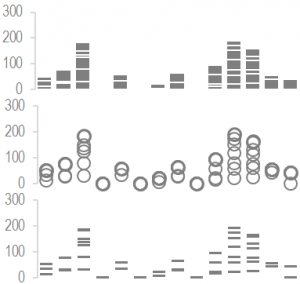
A lot of IT service management is focused on incidents and resolution SLAs by system or service provider. Looking instead at the frequency and duration of incidents painted a new picture of ‘disruption intensity’ for the Customer Journey.
After experimenting with several charts, a spark-bar was selected because the volume of the bars could be interpreted visually as a ‘disruption distribution’ and easily compared to other charts in a very small space.
Targeting Bullet Charts
In this case simple bullet charts were chosen to show performance of some measures against pre-determined service provider targets. The only colour in the entire dashboard was the red indicator used to ‘pop out’ these exceptions for rapid visual detection.
SLAs are often set to an arbitrary specification established through a contractual procurement process. These rarely reflect the real capability of a system or any cost/benefit optimisation. A pre-occupation with SLA compliance 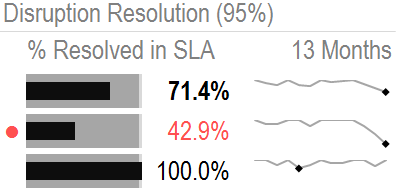 can produce wasted effort or avoidance behaviours.
“Changing the conversation about SLA compliance will take some time. We’d like to shift our focus to improving the capability of the system where investments have identifiable returns.
At least now we have clarity about what the measure of success should be for Silent IT. We can start to put a price tag on disruption losses and show evidence that we’re increasing value for the business.”