Client: NEW DIRECTION – The Foundation for European Reform
Company Type: Non-profit Think Tank
To develop ideas for a Scorecard for measuring the local value of EU law.
Vice President of the New Direction Think Tank, MEP Andrew Lewer, commissioned a ‘Scoreboard’ to assist with intelligence for the working group on ‘Subsidiarity and Localism’ in the Committee of the Regions.
The purpose of the Scoreboard was to raise the profile – and pressure for reform – of EU legislation, which is not fit for purpose in Regional Local Government.
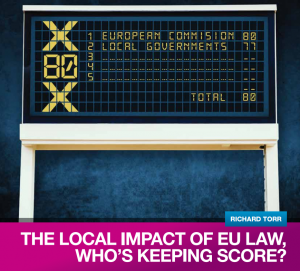
Measureology was hired as an ‘expert’ in the field to research and consider the best approach and to write the paper The Local Value of EU Law: Who’s Keeping Score which can be downloaded here.
Part One : Topic Research
The paper describes the concept of a Subsidiarity Scoreboard which seeks to detect which EU laws, once implemented, have lower value ‘on the ground’ than a more local option would have done. This new evidence will illuminate further those laws most in need of scrutiny and reform.
In order to begin, a great deal of research was undertaken to understand the technical complexities of the arena. It illustrates that you do not have to be an expert in the field itself, in order to provide quantitative and qualitative data, just an understanding of the methodology to discover the answers.
Part Two : The Scoreboard
The Scoreboard is a tool for monitoring the likelihood that the Subsidiarity Principle is under threat on the ground because of existing EU legislation. Making this evidence visible and transparent should help decisions about where to prioritise reforms, of both the legislation itself and the process which produced it.
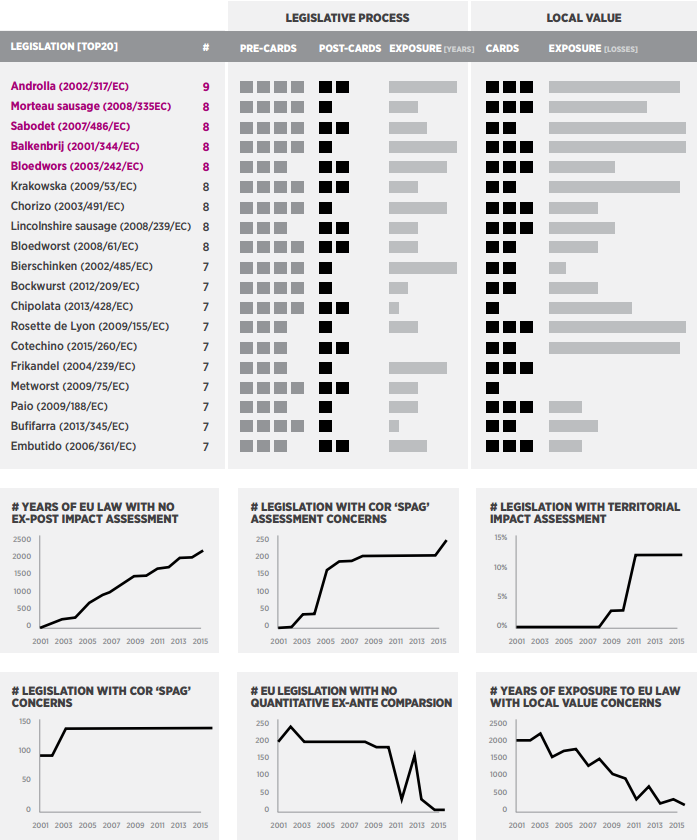
The Scoreboard re-uses the idea of ‘cards’ from the Early Warning System as a tangible way of ranking existing EU laws based upon concerns about both their subsidiarity journey and eventual local value. Grey and Black Cards were proposed – alongside the Yellow, Orange or Red – to accumulate ‘marks’ against legislation with elevated process and local value concerns.
This idea leads to the visual concept of clusters of Grey and Black Cards on a ‘Reform RADAR’ which reveal potential targets for subsidiarity or proportionality action.
Ultimately, a Scoreboard should lead to better decision- making. In this case, the two decisions were broadly:
- Which existing legislation should be prioritised for reform because of concerns about its lower value relative to a more local option?
- Which parts of the legislative process should be prioritised for reform to avoid concerns about local value in the future?
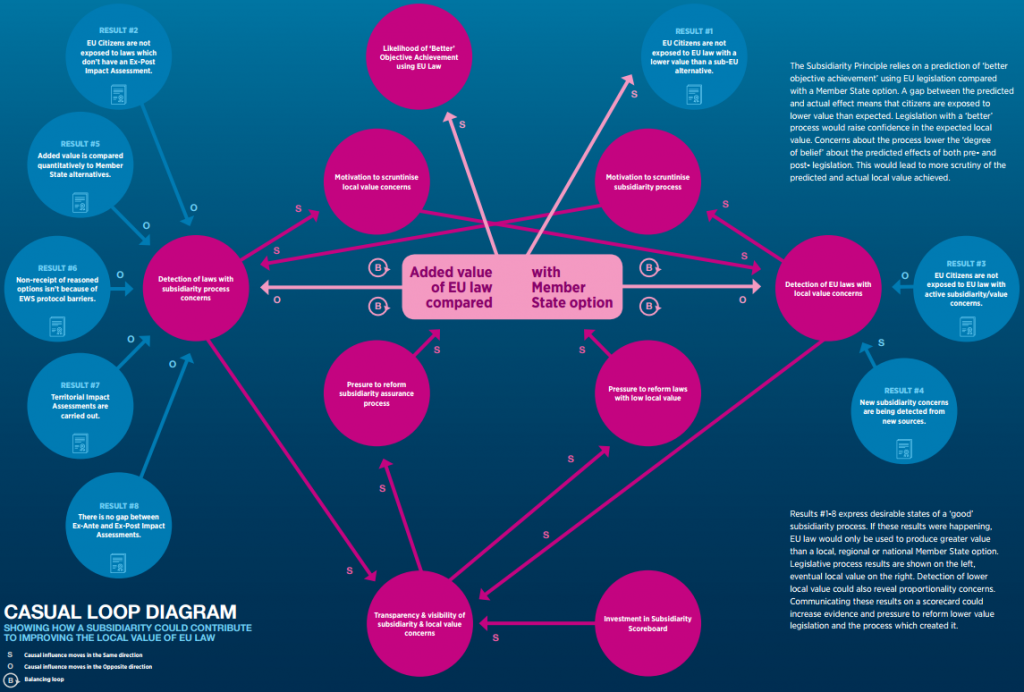
These ideas were formulated using Systems Thinking into Causal Loop Diagrams which were then distilled into a simplified model for the report.
If uncertainty exists in these decisions, the chosen priorities for reform have more chance of being wrong. For example, there may be an EU law which negatively affects a great many citizens, but does not appear on the current ‘Reform RADAR’.
To make these two decisions we needed to observe something about the EU legislation which is creating ‘lower value’ on the ground, as well as linking this back to likely process causes. In order to detect the value of this legislation relative to a local alternative, something needs to be measured.
This measurement may not need high accuracy to have decision value, indeed the data collected may be biased in terms of both beliefs and statistical error. This may trigger further measurement investments which seek higher value information. Conversely, not all measurements will have value in reducing uncertainty so we should avoid measuring things just because the data are easy to obtain.
Next, the measurement should be communicated in a way which creates insight and leads to a decision, even if that decision is to ‘do nothing’ or ‘do more measuring’.
Part Three : Visual Insight
The ambition for a Subsidiarity Scoreboard would be for it to be almost entirely graphical to aid rapid comparison and interpretation. It should be possible for an audience to gain a rich situational oversight of ‘subsidiarity’ within a single eye-span and answer questions which inform debate and ultimately a decision to act.
Visual displays are a powerful way to communicate information. When done well, visualisation can produce rapid cognition of the situation at hand. One ambition for the Scoreboard is that it would present its message visually to aid the ‘grasp’ of the message and increase the ‘stickiness’ of its recall. A less-than-perfect measure presented visually can produce more insight and inquiry than a table of numbers or words.
Unlike tables of words, this type of display needs quantitative information, encoded in visual form. Something needs to be observed and counted in the real world, in other words something about subsidiarity needs to be measured.
A well-designed visual Scoreboard should draw in a curious audience and lead them to seek further insights. The visual needs of the audience must be considered to steer a course between the executive ‘decision tool’ and the promotional ‘infographic’.
Publishing of the Scoreboard to the Internet will enable access and transparency.
The Outcome
Quote
“The research and case studies that respected expert in this field Richard Torr has put together, point the way forward to the creation of a ‘Subsidiarity Scoreboard’. The Scoreboard will take making such assessments out of the laboratory and the hands of only highly qualified statisticians and give it to those who work in local government or in business. These are the very people who need to know how new (or existing) rules work, what their impact could be and thus be in a position to lobby for changes or re-assessments.”
Andrew Lewer MP.
Vice-President of New Direction and a Vice- President of the Local Government Association. Conservative European Spokesman on Regional Development, Culture and Education and Chairs the ECR Policy Group on Subsidiarity and Localism.