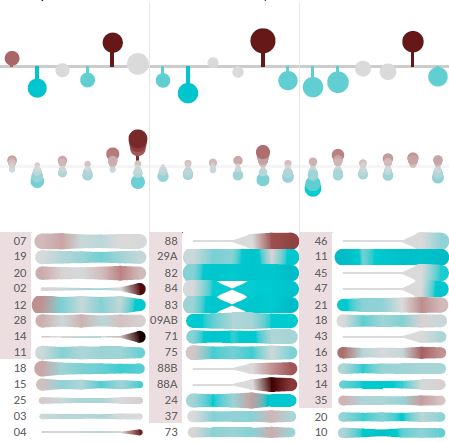
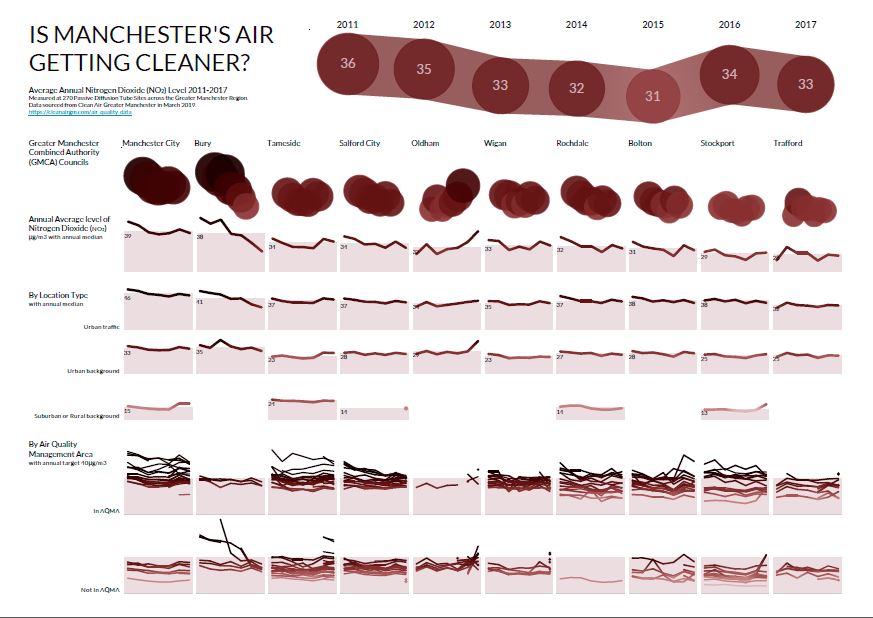
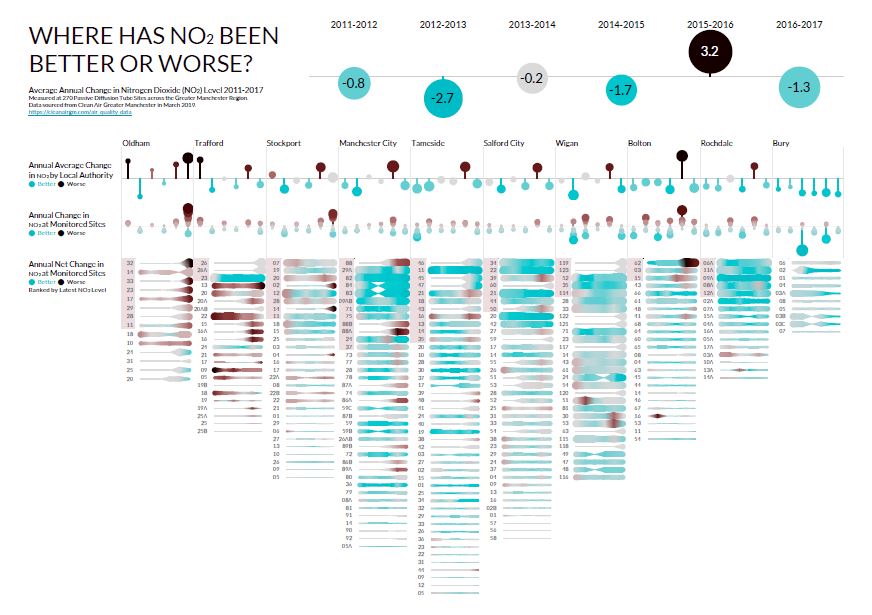
Here’s an example of a Decision Gallery based on public data from Clean Air Greater Manchester.
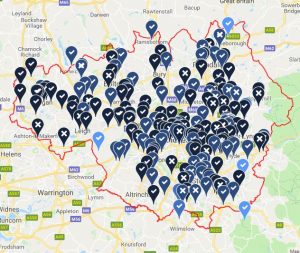
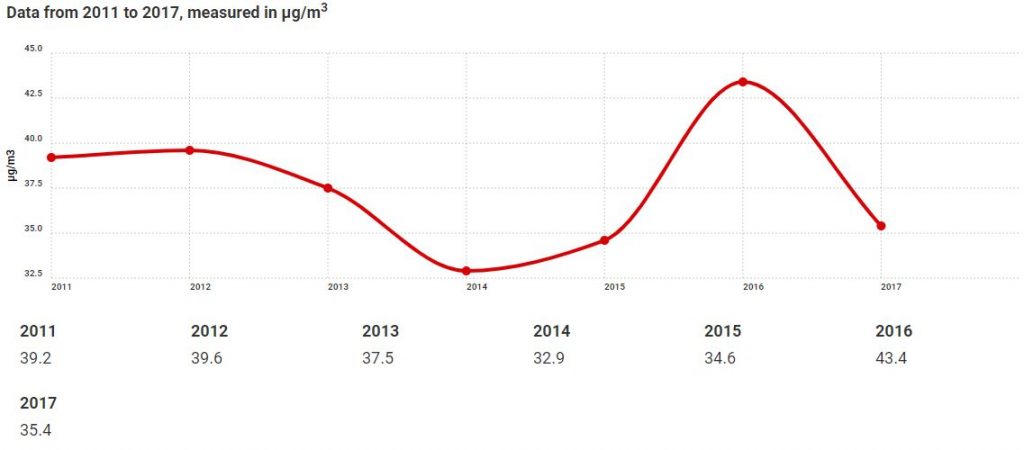
The existing data is organised around individual monitoring station locations. This makes it hard to see the big picture of whether air quality is really changing or not. The interpretation is also focused on the achievement of Air Quality Targets (less than 40μg/m3) rather than the big patterns of change.
Our series of 6 Insight Canvases explores the historical Diffusion Tube monitoring station data. It tells a richer story about how Air Quality is changing over time across the Greater Manchester Combined Authorities.
There are two broad questions:
- Is Air Quality getting better or worse?
- Where should interventions be focused to make it better?
You can download the Decision Gallery PDFs here
These are designed to be printed on A1-sized panels for a physical gallery but could also be adapted for online content.
With major Congestion Deal and Clean Air Plan initiatives launching in the region, a Decision Gallery is a way to reveal the evidence of whether change is working.
Many more data sources could be explored by this Decision Gallery, including active monitoring NO2/PM stations, traffic flows & vehicle emissions, population proximity, and health service demands.
A Causal Canvas would also explore the claimed links between congestion, air quality and pollution-related deaths.
