If you’ve had any exposure to continuous improvement thinking you’ll probably be familiar with the Fishbone Diagram.
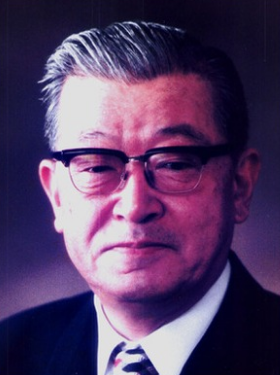
It was popularised by Japanese Quality Control pioneer Dr Kaoru Ishikawa who was himself influenced by Dr W Edwards Deming and a joint recipient of the Deming prize in 1952. Ishikawa is also credited with the idea of Quality Control Circles, small teams with a devolved improvement focus, the origin of Kaizen.
The Fishbone Diagram is one of the 7 basic quality tools, described by Ishikawa in his 1976 book ‘Guide to Quality Control’ and summarised nicely here by the ASQ. Because of its origins, its early use is associated with identifying the possible causes of manufacturing ‘defects’. Online resources now describe its use in much wider contexts, including the root cause analysis (RCA) of adverse events or problem analysis in Lean and Six Sigma projects.
A Fishbone Diagram is populated from a brainstorming activity, with ideas for causes generated around the problem stated at the fish ‘head’. Ideas are affinity-clustered into categories which can either be prescribed (eg. the 6 ‘M’s) or emerge from the material. Using exhaustive categories of causes ensures that all possible dimensions have been considered. Ideas which have obvious causal chains are arranged in a fish ‘bone’ connected to the spine of the fish. The ‘5 Whys’ technique is usually applied to drive out progressively more specific causes on multiple smaller bones.
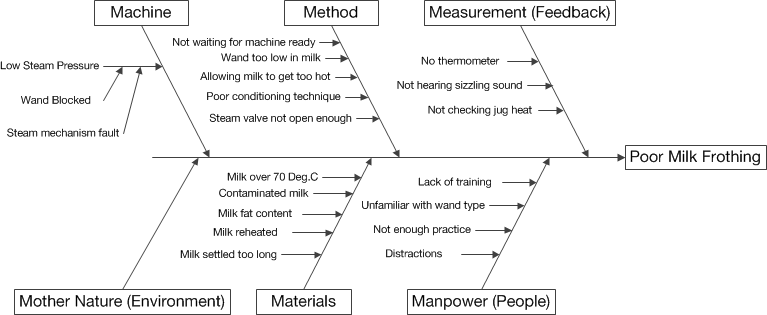
It helps if the problem being diagnosed is very clearly expressed so that the scope of possible causes are bounded. This prevents divergence towards catch-all claims such as “lack of resources”. The language used for each possible cause usually describes a ‘failure’ which could have contributed to the problem in some way eg. ‘Error messages weren’t acted upon’.
A well-facilitated session should focus the thinking on the visible material and defuse conflict or fear of blame. Once the diagram is populated, agreement needs to be sought on those claims which have stronger validity and evidence or need further investigation. Existing tensions could surface at this stage so dot-voting is one possible ‘democratic’ approach.
One of the strengths of the Fishbone Diagram is its problem-solving focus but this could become a weakness when trying to surface creative ideas. The effort converges on the problem rather than attempting to push thinking beyond to the ultimate effects. The use of prescriptive categories can also constrain thinking and linkages.
A ‘desired–result’ or ‘reverse’ variant of the Fishbone Diagram, annotated with positive ‘solution effects’ has more in common with the causal models we use at Measureology.