
The Capability Canvas is the Measureology way of visualising Capability Maturity Model (CMM) scores. CMMs might not be perfect, but the Capability Canvas helps to reveal priorities for finding valuable causal evidence.
There can’t be many management consultants, best practice frameworks or benchmarks which haven’t adopted the concept. The models are typically used to evaluate a ‘current state’ of a business process and compare it with a ‘future state’, higher up a metaphorical staircase.
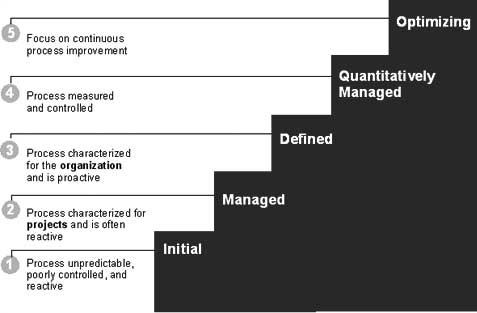
Business functions and processes are usually scored on a scale from ‘low maturity’ to ‘high maturity’. An ordinal scale of 1-5 is common with different statements about what maturity means at each level. There will always be an implicit gap between the score assigned (eg. 2) and a maximum score (eg. 5). There may also be a shortfall compared with a desirable ‘target’ score (eg. 4)
Scores can be self-reported by the people involved in the process or derived by external assessors. There can be loads and loads of capabilities and maturity scores and the interpretation and presentation can get quite challenging.
In order for this information to have value we must be able to make a better decision with it than we can without it. Gathering this information has a cost in terms of workshops, surveys, analysis. So what exactly is that decision and how does this scoring reduce uncertainty?
The decision in this case might be to prioritise those capabilities most in need of more improvement analysis work. A comparison amongst the different maturity gaps highlights which capabilities are furthest from their targets.
Here’s a way of visualising and ranking these gaps using the Capability Canvas. In this small example we might have a number of capabilities, some grouped together in a capability cluster.
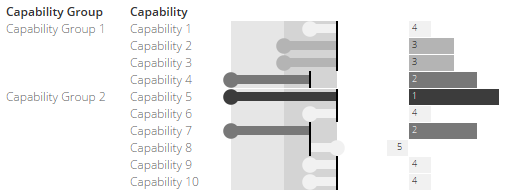
We start by adopting some of the features of a bullet chart. First, the background shading is used to partition the scale into 1-3 and 3-5. For each capability we plot the current score as a filled circle and the target as a reference line.
We then calculate the gap between the current score and the target score and plot this as the stick of a lollipop. Bigger gaps are also encoded with a more intense shading. So longer, darker lollipops = bigger gaps without a a traffic light in sight.
To help make the gap comparison directly, we also add a bar chart. This plots the gap again using length and colour but also labels these bars with a relative ranking.
At a glance we can see that Capability 5 is ranked with the biggest gap because its current score is 1 and its target score is 5.
We can also use this chart to roll-up the individual capabilities into their parent groups.

Because the groups are different sizes, we add up all the current scores, add up all the maximum scores and construct an overall maturity ratio. We can also encode the gaps between the aggregated current scores and the aggregated target scores.
This reveals that overall Capability Group 1 is slightly less mature than Capability Group 2, even though Group 2 contains the capability with the biggest gap.
So that’s a way of visualising Capability Maturity Models using a Capability Canvas.
But should we use Capability Maturity Models at all? We certainty need to be aware of the limitations in this kind of analysis:
- Even if there is a gap in a score, will investing in closing that gap make a difference? A big gap might look ‘bad’ but so what? The analysis would need to go much deeper to understand the causal effects of that gap.
- If we don’t know how much effect a higher score will have then where do the targets come from? This makes the targets and the gaps somewhat arbitrary.
- The statements about what low to high maturity states look like often don’t reflect the complexity of a situation, nor do they express a spectrum of states of the same thing.
- Because of this the scores can only ever be ordinal and express relative internal differences. They can’t be treated as interval scores and have calculations compared with other scores (eg. mean average scores)
- The typical scale of 1-5 is somewhat crude and insensitive to small shifts in opinion. It probably isn’t going to be very good at detecting improvement over time with statistical validity.
- Can an external opinion or a benchmark from another system ever yield a meaningful comparison? Each system will have a different purpose, strategy and dynamics to another even if the scores are normalised in some way.
- Skeptics might say that these maturity models are just a way for consultants to sell-on more gap-closing work. With this goal, there may be little motivation to validate whether gaps really need closing!
These obvious flaws aside, Capability Maturity Models can generate useful thinking and dialogue about where to focus efforts. Once visualised in a Capability Canvas a story with a set of themes will usually emerge.
Soliciting internal opinion for self-assessment can build buy-in. A comparison with an external opinion can be enlightening. Best practices or benchmarks can still help to generate ideas about how things could be better.
Having a Capability Canvas in your Decision Gallery is a reference stake in the ground; a snapshot of opinion at a point in time. But given the limitations of Capability Maturity Models it makes sense to move on to finding more direct causal evidence of the gaps and how closing them will make a difference.